Snowflake’s March 2026 anomaly detection update adds ML alerts, hourly drill-downs, and Cortex Explain. But detection alone doesn’t resolve cost issues. Learn where native monitoring stops and how APEX closes the accountability loop.
Last week a post started circulating in the Snowflake FinOps and data engineering community. Sri Subramanian broke down what Snowflake had quietly shipped in its March 2026 Anomalies UI update, and the reaction was significant. For good reason.
The update is genuinely impressive. Snowflake now lets you drill from an organization-level anomaly straight down to a specific warehouse, service type, and hour — then hit an “Explain” button powered by Cortex Code to get a natural language breakdown of what caused the spike. You can follow up with questions like “How is this different from last month?” or “What queries drove this compute cost?” All of it is also accessible programmatically via the new GET_HOURLY_CONSUMPTION_BY_SERVICE_TYPE method in the ANOMALY_INSIGHTS class.
We want to say this clearly: this is the right direction. Snowflake building native cost intelligence is good for the entire ecosystem. It validates what every FinOps lead and DataOps manager has known for years — Snowflake cost control is a real, unsolved organizational problem.
But here is what the excitement in that thread also reveals: most teams still do not have a clear picture of where native detection stops, and what happens after an anomaly is flagged. That gap is exactly what this post is about.
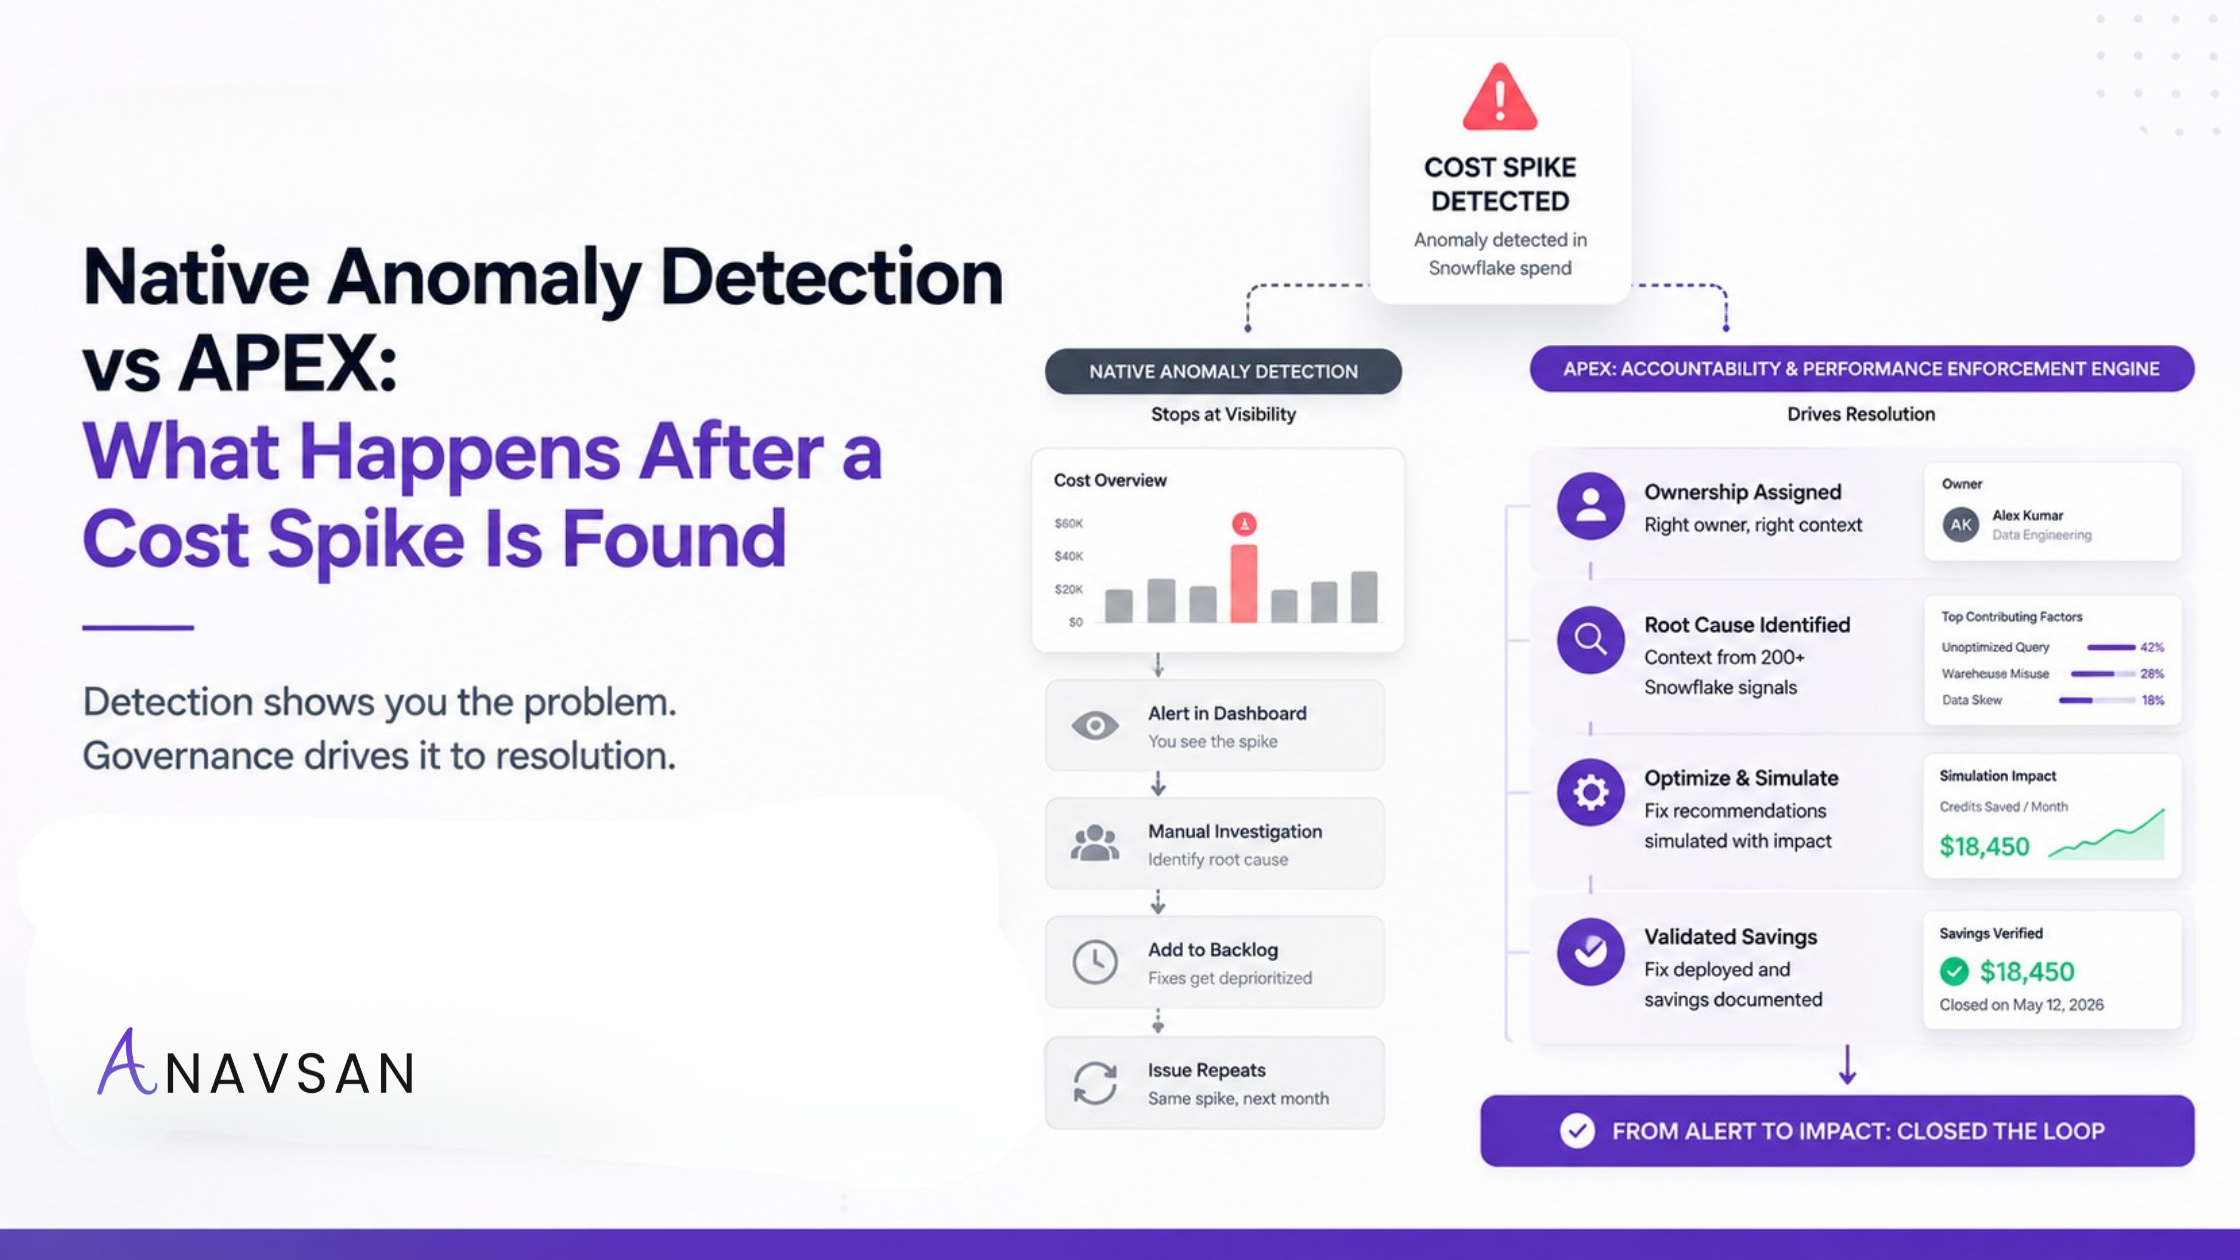
Snowflake can now tell you something went wrong and what caused it. The question it still cannot answer: who owns fixing it, and did they?
What the March 2026 update actually gives you
To be specific about what changed, here is the full capability set Snowflake now ships natively:
ML-based anomaly detection at account and organization level, using daily consumption patterns
Hourly drill-down by service type — compute, storage, AI_SERVICES, and others
Cortex Code “Explain” button in Snowsight for natural language root cause analysis
Follow-up questions in plain English: which warehouse, which queries, how does it compare to prior periods
Programmatic access via ANOMALY_INSIGHTS class and the new GET_HOURLY_CONSUMPTION_BY_SERVICE_TYPE method
That is a meaningful capability surface. Two years ago, getting this level of drill-down required custom SQL against ACCOUNT_USAGE views and a lot of manual work. The fact that it now exists in a UI with AI-powered explanation is a real step forward.
There is one important constraint buried in the documentation: the anomaly algorithm requires at least 30 days of prior consumption before it can flag anything. Accounts with fewer than 10 credits in the prior seven days are excluded entirely.
For teams with irregular workloads, new accounts, or usage patterns that vary significantly week to week, this means a significant blind spot at exactly the moments you need visibility most.
The three-stage problem, and where Snowflake stops
Snowflake cost control is not one problem. It is three sequential problems, and the native tooling now handles the first one well. Understanding where Stage 1 ends is the key to understanding why organizations with fully-configured Snowflake monitoring still have unresolved cost issues.
Stage 1: Detection
Something expensive happened. Where did the spend go? What service type drove the spike? What time did it occur? This is the question Snowflake’s native anomaly detection now answers, and it answers it well. The March 2026 update makes Stage 1 a solved problem for most organizations.
Stage 2: Assignment
Who owns fixing it? This is where Snowflake’s native tooling stops. When the Snowsight anomaly view surfaces a spike, a human being has to: interpret the explanation, map it to a team or engineer, figure out the right person to contact, send a message through some external channel (usually Slack), follow up when nothing happens, and start again next week when the same query runs.
There is no routing. No ownership assignment. No deadline. No organizational context about which team runs which workloads. Snowflake knows your consumption patterns. It does not know your team structures.
Stage 3: Documentation
Was it fixed? What did the fix cost? Who deployed it? Can FinOps report this to leadership next quarter?
Snowflake logs that an anomaly occurred. It does not log resolution. There is no closed-loop record, no before-and-after credit delta tied to a specific engineer’s action, no audit trail that a FinOps director can put in front of a VP or board. Every FinOps lead who has tried to answer “what did we do about the Q3 cost spike?” with data rather than memory has felt this gap.
Detection tells you something is wrong. Assignment makes someone accountable for fixing it. Documentation proves they did. Snowflake built Stage 1. APEX closes Stages 2 and 3.
The missing enforcement layer between detection and execution
Most Snowflake teams assume cost optimization is a monitoring problem. In practice, it is a decision execution problem.
Monitoring platforms surface anomalies. Metadata dashboards expose warehouse utilization. Cortex Explain identifies likely root causes. But none of these systems validate whether a proposed fix will actually reduce spend before deployment.
This is the gap enforcement platforms are designed to close.
An Accountability & Performance Enforcement Engine (APEX) introduces a decision layer between insight and action. Instead of asking:
what caused this spike?
it enables teams to answer:
what change should we make, who should make it, and what savings will it produce before we deploy it?
This shift moves Snowflake optimization from reactive investigation to controlled platform evolution.
Side-by-side: Snowflake native vs APEX
The table below maps the full capability surface as of April 2026.
Capability | Snowflake native Mar 2026 | Anavsan APEX | ||
|---|---|---|---|---|
✔ Full ◐ Partial ✘ Not available | ||||
STAGE 1 — DETECTION | ||||
Anomaly detection | ◐ | Daily ML-based, account + org level | ✔ | Continuous, 200+ signals — query, warehouse, storage, Cortex |
Drill-down granularity | ◐ | Account → warehouse → service type (hourly) | ✔ | Query-level + team attribution attached at detection |
Time to first signal | ✘ | 30-day minimum history required | ✔ | Day one — no warmup period |
AI-powered root cause | ✔ | Cortex Code “Explain” in Snowsight, natural language follow-up | ✔ | PKG-enriched root cause — org-specific context, not statistical |
Cortex AI cost visibility | ◐ | AI_SERVICES as a service type in anomaly breakdown | ✔ | Dedicated Cortex token + inference cost intelligence layer |
Programmatic access | ✔ | ANOMALY_INSIGHTS class, GET_HOURLY_CONSUMPTION_BY_SERVICE_TYPE | ✔ | Full API — ingests Snowflake’s own anomaly signals as upstream source |
STAGE 2 — ASSIGNMENT (Snowflake stops here) | ||||
Engineer ownership routing | ✘ | Not available — manual investigation required | ✔ | APEX identifies responsible engineer and routes automatically |
Slack workflow delivery | ✘ | Snowsight UI only — no Slack integration | ✔ | Cost problem + PKG context delivered to engineer in Slack with action buttons |
Organizational context | ✘ | Statistical patterns only — no team structure awareness | ✔ | Private Knowledge Graph — team ownership, workload history, prior fix patterns |
PKG compounding intelligence | ✘ | Algorithm resets — no organizational learning | ✔ | Every resolved fix trains the engine — more precise each week |
Pre-deployment simulation | ✘ | Not available | ✔ | Credit Simulator validates savings before any fix reaches production |
Query optimization + rewrite | ✘ | Diagnosis only — no fix capability | ✔ | PKG-driven rewrite via Cortex Code + Claude Code with org context |
STAGE 3 — DOCUMENTATION (the closed loop) | ||||
Resolution tracking | ✘ | Anomaly logged — no resolution state | ✔ | Every cost problem tracked from assignment through closure |
Audit trail with attribution | ✘ | Not available | ✔ | Engineer, fix, credit delta, timestamp — versioned and logged |
Board-ready FinOps reporting | ✘ | No resolved-item reporting or savings proof | ✔ | Governance dashboards with closed-loop proof for leadership |
GitHub version control | ✘ | Not available | ✔ | Query versions synced to GitHub — every production change traceable |
DELIVERY — PACKAGING & REACH | ||||
Multi-client PS delivery | ✘ | Single account — no managed services architecture | ✔ | Multi-tenant console for PS firms — one engineer, many client accounts |
White-label / OEM | ✘ | Snowflake-branded only | ✔ | White-label APEX engine for partner delivery under their brand |
Multi-platform roadmap | ✘ | Snowflake only | ◐ | Snowflake now → Databricks, BigQuery, Azure Synapse coming |
Why simulation changes the economics of Snowflake optimization
One of the least visible risks in Snowflake optimization is uncertainty.
Engineers often know a query rewrite, warehouse resize, or retention adjustment should reduce spend — but validating that assumption normally requires deploying the change against production workloads. That introduces risk, consumes credits, and slows adoption of optimization improvements.
APEX introduces a credit simulation layer that estimates the impact of changes before execution. This turns optimization from guesswork into engineering:
FinOps teams can prioritize savings opportunities based on expected ROI
engineering teams can validate performance impact before deployment
platform teams can avoid regressions across downstream workloads
Instead of experimenting in production, teams evaluate changes in advance and deploy only the ones that are provably beneficial.
The architectural response: use Snowflake’s detection as an input
One question this raises is worth addressing directly: if Snowflake now does Stage 1 well, should APEX stop doing its own detection and simply consume Snowflake’s anomaly signal? The answer is: consume it as one source, not the only source.
Snowflake’s ANOMALY_INSIGHTS output — including the new hourly service type breakdown — becomes one of APEX’s Private Knowledge Graph signal inputs. When Snowflake flags an anomaly and Cortex Code generates an explanation, APEX ingests that as a structured event with Snowflake’s own root cause reasoning attached. This enriches the PKG with the platform’s own validated signal rather than duplicating it.
What APEX does not give up is independent signal ingestion. The PKG still reads 200+ raw Snowflake signals directly. The 30-day warmup constraint means Snowflake’s native detection misses new accounts, irregular workloads, Cortex token spikes below the anomaly threshold, and warehouse misconfigurations that haven’t yet produced a detectable daily spike. APEX catches what Snowflake’s algorithm cannot flag.
The more important architectural point is what happens after ingestion. Snowflake’s Cortex Code can explain that a warehouse had a spike from AI_SERVICES. The PKG explains what it means in your specific organization: which team owns that warehouse, who ran the Cortex workload that caused the spike, whether this pattern appeared before, and what the fix was when it did. Cortex Code explains the signal. The PKG explains the signal in organizational context. Those are different things.
Organizational context is the missing variable in anomaly intelligence
Snowflake’s anomaly engine explains what happened statistically. It does not explain what it means operationally. APEX’s Private Knowledge Graph (PKG) changes this by mapping relationships between:
queries
warehouses
schemas
teams
pipelines
prior fixes
ownership history
Instead of rediscovering the same inefficiencies repeatedly, optimization becomes cumulative. Each resolved issue improves routing accuracy and prioritization for the next one.
This transforms anomaly response from a weekly investigation workflow into a continuously learning enforcement system.
Why monitoring alone stops scaling in mature Snowflake environments
In early Snowflake deployments, anomaly detection and dashboards are often enough.
But as environments expand across:
analytics workloads
orchestration pipelines
Cortex AI usage
departmental marts
multi-account deployments
optimization becomes a coordination challenge between engineering, FinOps, and platform teams rather than a visibility problem.
At that point:
monitoring explains symptoms
simulation validates fixes
routing enforces ownership
documentation proves outcomes
APEX is designed to operate across all four layers simultaneously.
This is why enforcement infrastructure is emerging as a new category alongside observability and FinOps tooling rather than replacing them.
What this means for teams using Snowflake’s native features today
If your team is already using Snowflake’s native cost anomaly detection, this is what you should expect:
You will see anomalies. The new UI is good at surfacing them with hourly granularity and AI-powered explanation.
You will not have a clear answer to who owns the fix. Routing it to an engineer still happens through Slack, email, or institutional memory.
You will not have a record of whether it was resolved. FinOps leaders building quarterly cost narratives will still be doing it from memory and scattered notes.
You will need 30 days of history before detection starts. New workloads and new accounts have no coverage during that window.
None of this is a criticism of Snowflake’s engineering. Detection is genuinely hard, and what shipped in March 2026 is a meaningful advance. The gap is structural, not a product shortfall. Snowflake is a data platform. Workflow enforcement, organizational routing, and audit documentation are a different class of problem — one that requires knowing your team structures, your fix history, and your accountability patterns, not just your consumption data.
Every FinOps leader who has bought a monitoring tool and still has unresolved cost problems has experienced Stages 2 and 3 firsthand. The problem was never visibility. It was accountability.
APEX is not a monitoring alternative. It is a control plane for Snowflake optimization.
Traditional Snowflake cost tooling answers:
where credits were spent
which warehouse spiked
which queries consumed resources
APEX answers a different class of questions:
which optimization action produces the highest savings right now
who owns implementing it
what the expected credit delta will be before deployment
whether the fix was completed
how savings accumulate across quarters
This distinction matters because most Snowflake inefficiency does not come from missing visibility. It comes from unresolved optimization decisions.
Monitoring surfaces problems. Enforcement ensures they are closed. That shift — from dashboards to decision infrastructure — is what defines the APEX category.
APEX starts where anomaly intelligence ends
Snowflake’s March 2026 anomaly detection release marks a turning point. Detection is no longer the bottleneck. Execution is. Teams now know when anomalies occur, what caused them, and how they compare historically. What they still lack is:
ownership routing
pre-deployment validation
resolution tracking
institutional optimization memory
That is the enforcement gap.
APEX completes the loop by turning anomaly signals into accountable optimization workflows with measurable outcomes — transforming Snowflake cost management from monitoring infrastructure into governance infrastructure.
Start a 14-day free trial — Snowflake connected in under 5 minutes, no credit card required.
See how Anavsan governs your Snowflake costs
APEX detects cost anomalies, assigns them to the owning engineer, and documents savings with proof — automatically.