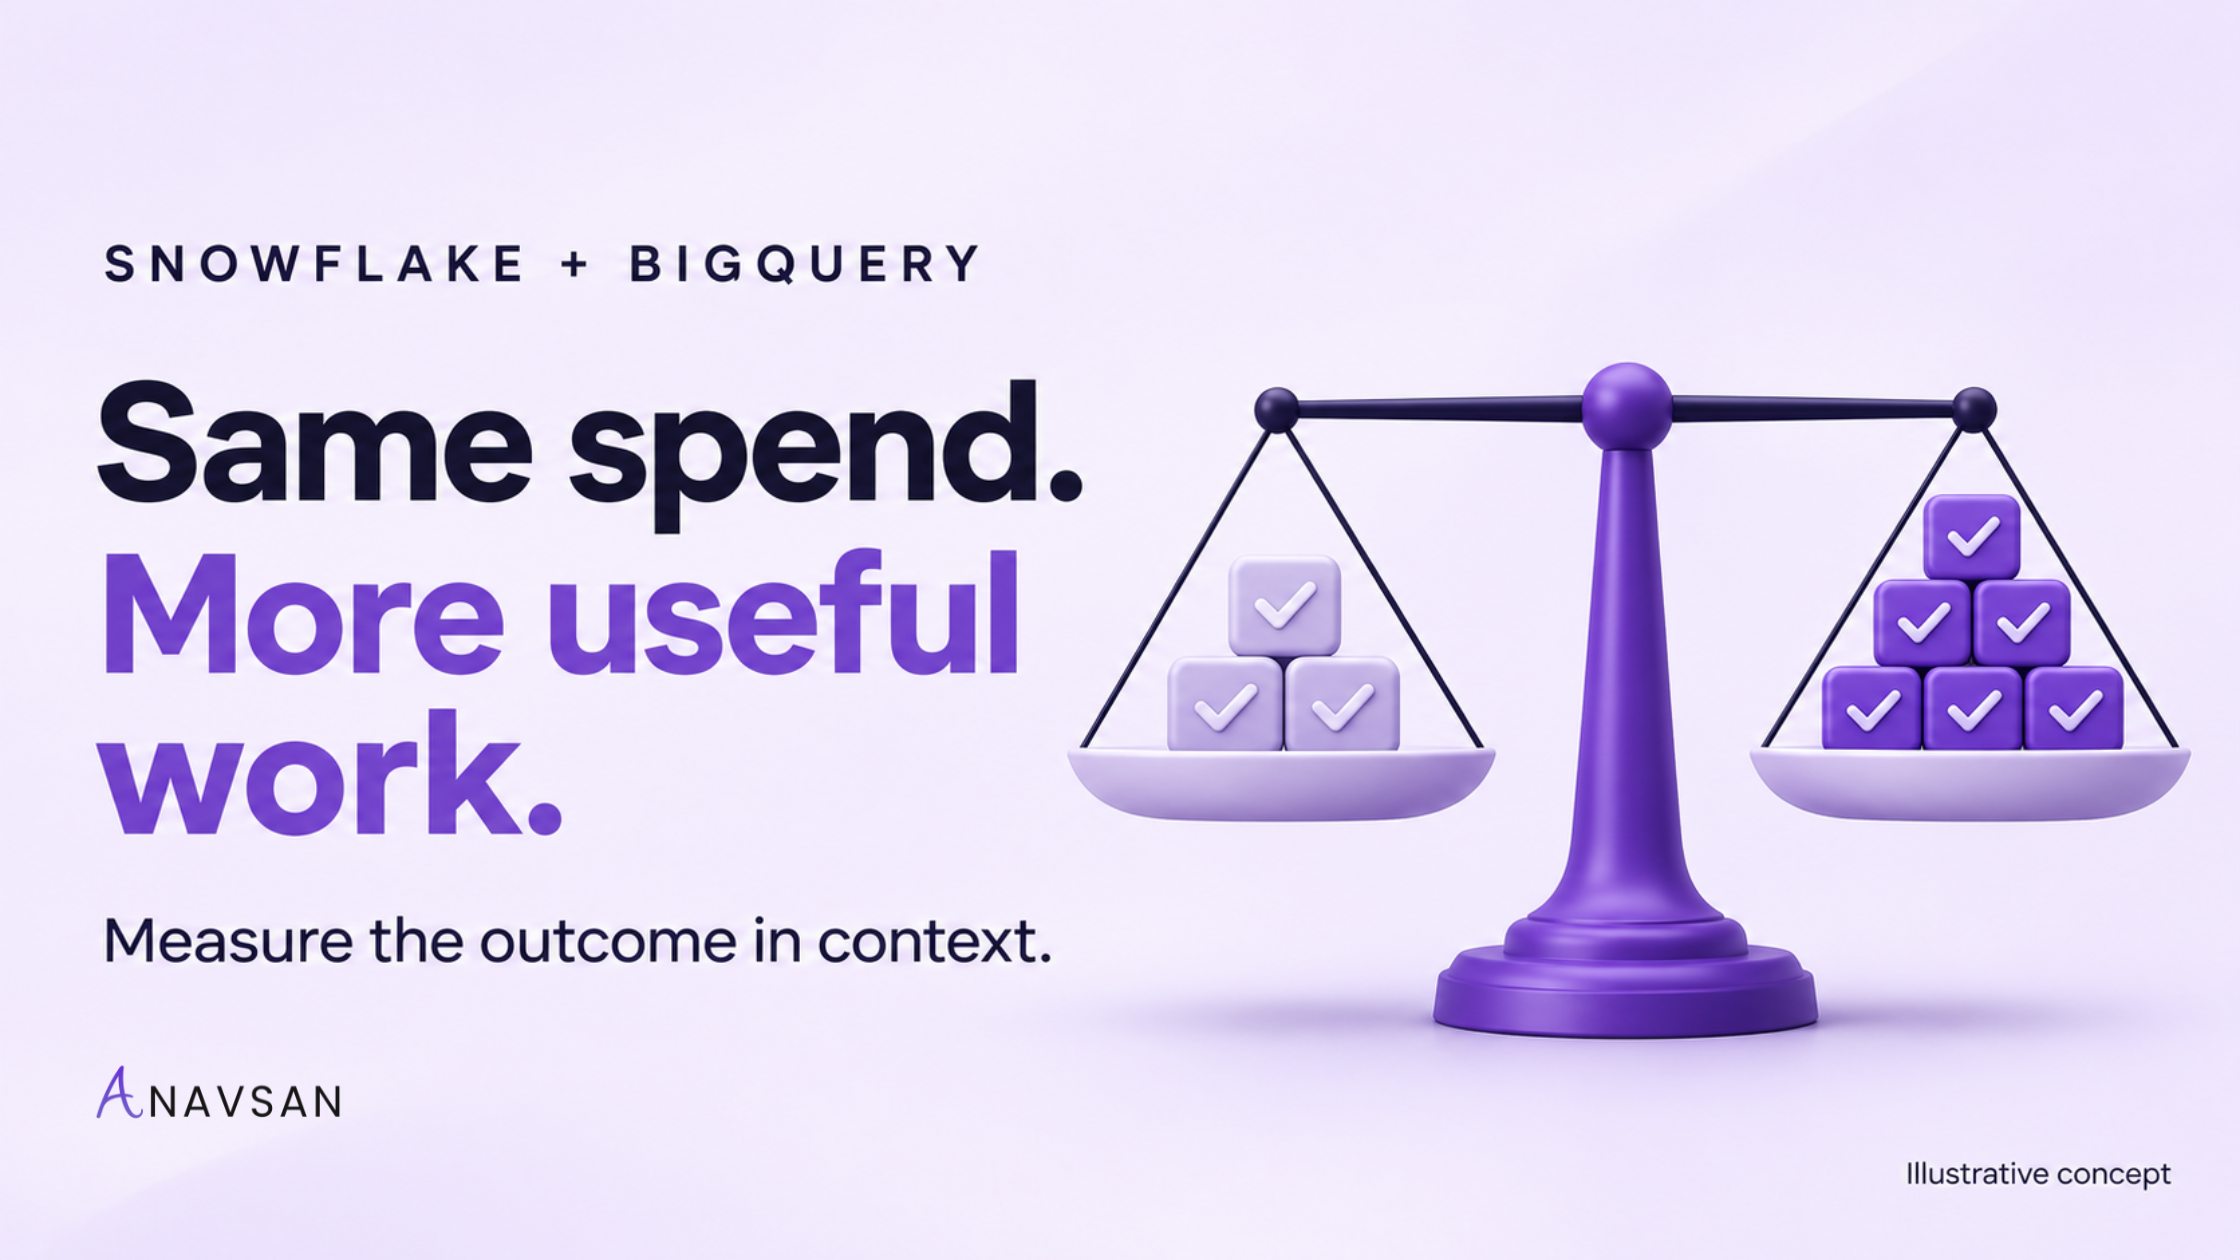
Was the optimization unsuccessful, or did the business receive more useful work for the same spend?
Across Snowflake and BigQuery, the invoice answers an essential financial question. It does not, on its own, tell you whether delivering the same outcome became more efficient. For that, the review needs a consistent unit of work, a defensible cost boundary and evidence that service quality held.
A cost-per-outcome scorecard connects workload spending to accepted results. It gives engineering and finance a shared way to describe improvement without relabeling every resource reduction as cash savings.
- Choose a business-relevant outcome, such as a completed reporting cycle or a validated processing batch.
- Count accepted outcomes, not every query execution or retry.
- Keep workload scope, cost allocation and service requirements consistent across periods.
- Report total spend, unit cost and service quality together.
- Separate observed efficiency from attributable optimization benefit and realized invoice reduction.
- Revisit the scorecard when workload mix, pricing or delivery requirements change.
What is cost per outcome?
Cost per outcome is the cost assigned to a defined workload divided by the number of accepted outcomes that workload delivered in the same period.
Cost per accepted outcome = in-scope workload cost ÷ accepted outcomes delivered
“Accepted” is the important word. A batch that finishes but produces incomplete data should not count as useful delivery. A report that misses the decision deadline may not meet its service requirement. A retry can consume resources without creating an additional outcome.
The FinOps Foundation describes unit economics as connecting technology spending with the value it produces and distinguishes resource-efficiency metrics from business-unit metrics. [1] For data teams, the practical task is selecting a unit that supports a real operating decision.
Start with the decision the metric should support
Before building a dashboard, ask what you want the scorecard to help decide.
Are you evaluating a query rewrite? Deciding whether to change a refresh schedule? Checking whether growing demand fits within current capacity? Comparing a workload’s delivery pattern before and after a deployment?
Each decision needs a different denominator. Cost per query can help inspect repeated executions, but a successful rewrite may combine several queries into one. A query-count denominator would then change because of the implementation, even if the business received exactly the same result.
Choose a unit that remains meaningful when the implementation changes.
| Workload | Possible accepted outcome | Acceptance condition |
|---|---|---|
| Scheduled reporting | Completed reporting cycle | Correct output available by the agreed deadline |
| Data ingestion | Validated batch or a defined volume of accepted records | Completeness and quality checks pass |
| Customer analytics | Delivered customer report | Comparable report scope and response target |
| Data enrichment | Accepted enriched records | Required fields and quality criteria pass |
These units support comparison within a defined workload. They do not make unlike workloads interchangeable. A simple lookup and a complex financial reconciliation should not share a cost target merely because both end with a query result.
The six fields in a useful scorecard
Keep the first version small enough for an engineer and a finance partner to review together.
| Field | What to record | Why it matters |
|---|---|---|
| Workload boundary | Included jobs, datasets, services and owners | Prevents cost moving outside the comparison |
| Accepted outcome | Unit definition and rejection rules | Prevents retries or incomplete work inflating output |
| Cost basis | Included charges, rates and allocation method | Makes the numerator reproducible |
| Comparison period | Dates, seasonality and workload cohorts | Avoids comparing unrelated demand patterns |
| Service requirements | Correctness, freshness, latency and reliability | Keeps lower cost from masking worse delivery |
| Change evidence | Deployment, concurrent changes and review date | Supports a defensible explanation of the result |
Include engineering effort and recurring tooling costs in the overall business case when material. They may sit outside the platform-cost scorecard, but they should not disappear from the investment decision.
A worked example: flat spend, lower unit cost
Consider two equal-length periods for a hypothetical processing workload. Assume accepted batches contain comparable work, cost allocation is unchanged and service requirements are met.
| Measure | Before | After |
|---|---|---|
| In-scope attributed cost | $500 | $500 |
| Accepted equivalent batches | 1,000 | 2,000 |
| Cost per accepted batch | $0.50 | $0.25 |
| Change in attributed total cost | — | 0% |
| Change in cost per accepted batch | — | −50% |
The unit cost fell by half. Total attributed cost did not fall.
That supports the statement: the workload delivered twice as many equivalent accepted batches at the same attributed cost. It does not establish a $250 invoice saving, nor does it prove the optimization caused the entire improvement.
Demand growth may have spread a fixed cost across more output. A concurrent change may have reduced work. The batch mix may have shifted. Before claiming an intervention’s impact, investigate those explanations.
Unchanged cost, doubled accepted batches and halved cost per batch — not an invoice saving.
Why a lower unit cost does not prove the fix caused it
Suppose the original $500 consisted of $300 in fixed allocated cost and $200 in variable cost for 1,000 batches. The baseline variable cost was $0.20 per batch.
At 2,000 batches, an illustrative no-change model would predict:
$300 fixed cost + (2,000 × $0.20) = $700
If actual post-change cost is $500, the model suggests a $200 difference relative to that expected baseline. It does not suggest a $500 saving simply because doubling the old average unit cost would produce $1,000.
This model is useful only when the fixed component, variable behavior, rates and batch complexity remain appropriate. Capacity thresholds, caching and workload mix can make linear assumptions unsuitable. Label the result as a modeled difference and retain the assumptions.
For a stronger comparison, examine similar unaffected workloads, use staged rollout evidence where feasible, and record simultaneous pricing or configuration changes. Sometimes the correct conclusion is “efficiency improved; the contribution of this specific fix remains uncertain.”
Apply the scorecard to Snowflake
Start with the workload boundary rather than assuming a warehouse is a single business service. Shared infrastructure can support several teams and outputs.
Snowflake’s QUERY_ATTRIBUTION_HISTORY provides query-attributed compute credits, but excludes warehouse idle time and other categories such as storage and data transfer. Query-level attribution is therefore not the complete workload cost. Snowflake also documents separate treatment for Adaptive Warehouses, so select the applicable usage source for the warehouse type. [2]
For your scorecard, decide how to handle shared and unallocated costs. Keep the rule stable. If idle cost is excluded, show it separately instead of implying the sum of query costs reconciles to the whole bill.
A faster query can be valuable because it meets a response target or frees capacity. To claim lower spend, identify the mechanism that reduces charged consumption and verify that it occurred. The runtime improvement and the financial result belong in separate fields.
Apply the scorecard to BigQuery
First identify the pricing model. BigQuery on-demand compute is charged by data processed, while capacity-based compute is charged for slot capacity over time. The same engineering improvement can therefore have different financial consequences. [3]
For an on-demand workload, review the relevant billed processing and other included charges. For a capacity-backed workload, examine the reservation cost boundary and how shared capacity is allocated to the workload. A reduction in utilized slot time is useful evidence of efficiency, but it does not by itself establish that billed capacity declined. [4]
The scorecard should distinguish three outcomes: lower workload resource consumption, capacity made available for other work, and a verified reduction in billed cost. More than one may occur, but none should be assumed from another.
Protect the denominator from misleading improvement
A cost-per-outcome metric can look better while the service gets worse. Review these failure modes before presenting it:
- Retries counted as delivery: include their cost, but count the accepted output once.
- Smaller work units: check whether the “same” batch now contains fewer records or easier processing.
- Failures excluded from cost: retain the cost of unsuccessful attempts within the workload boundary.
- Fewer quality checks: confirm that correctness requirements were preserved.
- Delayed outputs: retain freshness and response-time measures beside cost.
- Costs moved elsewhere: include relevant new storage, orchestration or execution costs.
If there are zero accepted outcomes, do not report zero unit cost. Mark the measure undefined and investigate the delivery failure.
The best denominator is one stakeholders can challenge and reproduce. Document it alongside the number, rather than hiding its definition in a dashboard tooltip.
Turn the scorecard into a weekly review
Begin with one important workload and one owner. Record its baseline, proposed change and the service requirements that must remain true. Agree on the measurement window before the change is delivered.
During the review, ask in this order:
- Did the workload deliver the accepted outcomes required?
- Were the before-and-after outcomes comparable?
- What happened to total in-scope cost and cost per outcome?
- What evidence links the change to the result?
- Should the next action be further optimization, a capacity decision, investigation or no change?
An unchanged configuration can be a sound outcome when the workload is efficient and meeting its requirements. The scorecard should support judgment rather than require a new tuning task every week.
Where Anavsan APEX fits
Anavsan’s Enforcement Desk connects an actionable finding with evidence, ownership, a proposed change and a reviewed delivery path. Its documented approach distinguishes a resolved finding from one deliberately archived with a reason. [5]
That workflow supports Trace → Assign → Enforce → Prove. The scorecard in this article is a recommended review template, not a claim that APEX automatically knows every organization’s business-output denominator. Teams still need to define accepted outcomes and reconcile their chosen cost boundary.
For the broader distinction between resource reduction and financial savings, see Your Cloud Bill Dropped. Did You Actually Save Money?.
Bring one workload to your next review with three numbers: total cost, accepted outcomes and cost per outcome. Add the service requirements beside them. The conversation becomes much more useful when everyone can see what the spend delivered.
Frequently asked questions
Continue reading
- Your Cloud Bill Dropped. Did You Actually Save Money? — how to separate resource reduction from verified financial savings
- Dollars and Sense: Reduce Snowflake and BigQuery Costs Without Sacrificing Performance — protecting delivery while improving efficiency
- Which Cloud Data Workload Should You Optimize First? — choosing the next fix with impact, evidence and ownership
- APEX Enforcement Desk
Sources
Technical references reviewed November 2, 2026. Both numerical examples are hypothetical, not customer savings claims. The scorecard is an editorial framework.