Learn why full table scans increase Snowflake credit consumption, how micro-partition pruning works, and how teams can reduce workload costs with better filters, clustering, and query governance.
Introduction
Snowflake cost governance is often treated as a warehouse-sizing problem. Teams look at which warehouse consumed the most credits, which dashboard ran longest, or which pipeline caused a usage spike.
That visibility matters, but it does not always explain the root cause. One of the most common workload-level cost drivers is the full table scan.
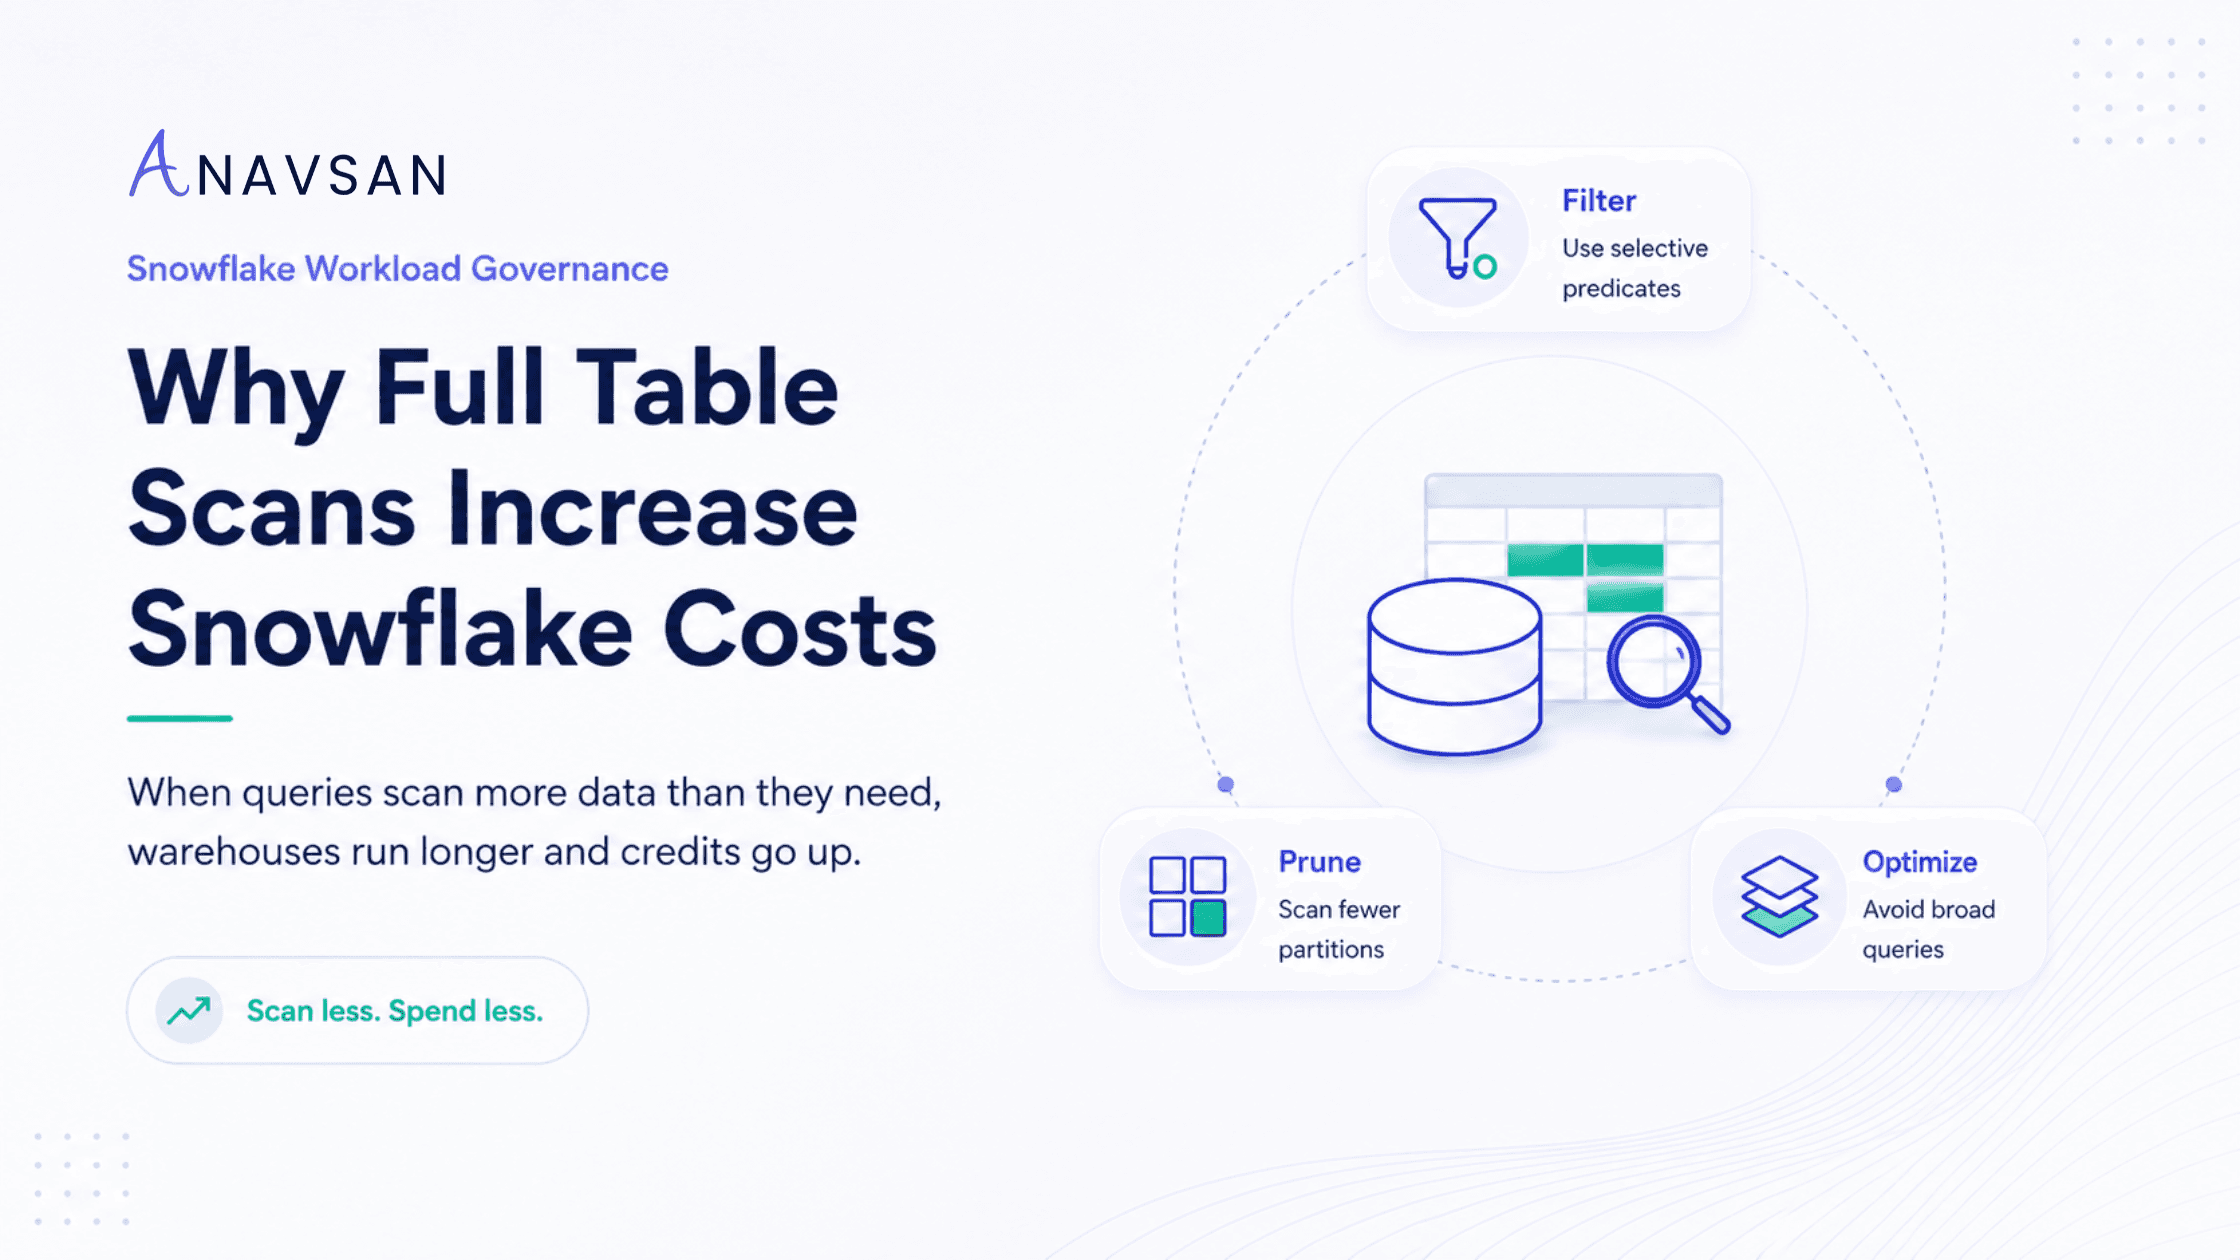
A full table scan happens when a query reads far more data than it needs. Instead of scanning only the relevant portions of a table, the query ends up reading most or all of it. On small tables, this may not matter. On large Snowflake tables with millions or billions of rows, it can directly increase execution time, warehouse runtime, and credit consumption.
In simple terms:
The more unnecessary data a query scans, the longer it usually runs. The longer it runs, the more Snowflake credits it can consume.
This is why full table scans are not only a query-performance problem. They are a Snowflake cost governance problem.
What is a full table scan in Snowflake?
A full table scan means a query reads an entire table, or a very large percentage of it, during execution.
For example, this query may scan the entire orders table:
That may be acceptable for exploration on a small table. But on a large production table, it can be expensive.
A more targeted query might look like this:
This second query gives Snowflake a better chance to scan only the data relevant to January 2026, assuming the data layout and query predicates allow effective pruning.
The key difference is not only syntax. The difference is how much data the warehouse has to process.
Why full table scans increase Snowflake costs
Snowflake warehouses consume credits while they run. A query that scans more data usually requires more compute work: more data read, more columns processed, more intermediate results created, and more time spent executing.
The cost pattern looks like this:
Poor filter or poor pruning → more partitions scanned → longer execution → more warehouse runtime → higher credits.
Full table scans can also create secondary performance problems. When a query reads too much data, it may produce larger intermediate results. Those intermediate results can increase memory pressure, slow joins and aggregations, and in some cases contribute to query spillage.
So a full table scan may not stay isolated. It can trigger a chain of workload inefficiencies.
How Snowflake avoids unnecessary scanning
Snowflake stores table data in small storage units called micro-partitions. These micro-partitions include metadata such as value ranges and distinct value information. Snowflake can use this metadata to skip micro-partitions that are not needed for a query.
This skipping process is commonly referred to as partition pruning.
For example, if a table contains one year of order data and a query only asks for January orders, Snowflake may be able to skip many micro-partitions that do not contain January data.
But pruning depends on the query and the data layout.
If a query has no filter, Snowflake has little opportunity to skip data. If a query applies filters in a way that cannot be used effectively for pruning, the warehouse may still scan far more data than expected. If the table is poorly clustered for the query pattern, Snowflake may need to scan many overlapping micro-partitions.
That is why “we are using Snowflake, so pruning will handle it” is not a complete governance strategy. Snowflake provides powerful pruning capabilities, but workload design still matters.
Common causes of full table scans
Full table scans usually come from a few recurring workload patterns.
1. Missing WHERE clauses
The most obvious cause is a query without a filter.
On a small table, this may be harmless. On a large event table, it can trigger a high-volume scan. If this query is part of a dashboard, notebook, or scheduled job, the cost impact can repeat frequently.
2. SELECT *
SELECT * tells Snowflake to return every column. Because Snowflake uses columnar storage, scanning only the columns needed by a query is usually more efficient than scanning all columns.
A better pattern is:
This reduces both column scan and row scan pressure.
3. Filters on the wrong columns
A query may have a filter, but not one that helps Snowflake skip much data.
For example, filtering by a low-selectivity column such as status = 'active' may still scan most of the table if most records are active. Filtering by a more selective column such as date, region, tenant, customer, or event type may be more effective depending on the data model.
4. Functions applied to filter columns
This pattern can reduce pruning effectiveness:
A better pattern is often a range filter:
The second version gives the optimizer a clearer range to work with.
5. Poor clustering for the workload
Snowflake automatically micro-partitions data, but very large tables can become less efficient for certain query patterns over time. If a table is frequently queried by order_date, customer_id, or region, but data is not well organized around those access patterns, Snowflake may need to scan more micro-partitions.
This is where clustering can help, but it should be used carefully because clustering also has maintenance cost.
6. BI dashboards with broad filters
Dashboards often generate queries behind the scenes. A user may click a broad date range or leave filters blank, causing the BI tool to scan large tables repeatedly.
A single dashboard refresh may not look alarming. But when hundreds of users trigger the same broad scans every morning, it becomes a workload governance issue.
How to detect full table scans
To detect full table scans, look beyond the total warehouse credit number.
Useful signals include:
High bytes scanned
High percentage of partitions scanned
Long execution time
Repeated scans from the same dashboard or pipeline
Queries using
SELECT *Queries without selective filters
Queries scanning large tables during scheduled refreshes
Tables where clustering depth has degraded
Query profiles showing poor pruning
The goal is not to eliminate every large scan. Some analytical workloads genuinely need to read a lot of data. The goal is to identify avoidable scans: queries that read far more data than the business question requires.
How to reduce full table scans
1. Add selective filters
The simplest fix is often the most effective: filter earlier and filter better.
Use clear predicates on columns that narrow the dataset meaningfully. Date, timestamp, tenant, account, customer, region, event type, and partition-like business dimensions are common examples.
2. Avoid SELECT * in production workloads
For ad-hoc exploration, SELECT * may be convenient. For production dashboards, pipelines, and repeated jobs, it is usually a bad habit.
Select only the columns needed by the workload. This improves scan efficiency and reduces unnecessary data movement.
3. Rewrite filters to help pruning
Avoid wrapping filter columns in functions when a range predicate can express the same logic. Instead of converting timestamps to dates inside the filter, use timestamp ranges.
This small change can make a big difference in how much data Snowflake can skip.
4. Review clustering only where it is justified
Clustering can improve scan efficiency for very large tables, especially when frequent queries filter on the same columns. But clustering is not free. Snowflake notes that clustering keys are not intended for all tables because there is cost to initially cluster and maintain the data.
A practical rule is:
Cluster only when the query-performance improvement offsets the clustering maintenance cost.
5. Separate exploratory and production workloads
Ad-hoc analysts may need flexibility. Production dashboards and scheduled jobs need discipline.
Running both on the same warehouse can make governance harder. Separating workload classes helps teams identify whether scans are coming from exploration, BI, ELT, dbt jobs, or automated processes.
6. Track recurring offenders
A full scan that runs once may be acceptable. A full scan that runs every hour is a cost leak. Governance should prioritize recurring scans, especially those tied to dashboards, scheduled transformations, or partner tools.
Why this matters for Snowflake cost governance
Full table scans are a perfect example of why cost governance must happen at the workload level.
A monthly Snowflake bill can tell you spend went up. A warehouse dashboard can show which warehouse consumed credits. But the real cause may be a single recurring query scanning a large table unnecessarily.
This is the shift teams need to make:
From: “Which warehouse is expensive?”
To: “Which workload behavior is causing unnecessary spend?”
Full table scans are not always wrong. Sometimes they are required. But when a query scans an entire table because filters are missing, clustering is misaligned, dashboards are too broad, or query patterns are repeated without ownership, the issue becomes governance.
Good governance connects the scan to the owner, the workload, the business purpose, and the fix.
Practical checklist for data teams
Use this checklist when reviewing high-scan Snowflake queries:
Does the query scan most of a large table?
Does it use
SELECT *?Are filters missing or too broad?
Are functions applied to filtered columns?
Are date ranges written clearly?
Are dashboard filters defaulting to “all time”?
Is the query repeated frequently?
Does the table support the access pattern?
Would clustering improve pruning enough to justify maintenance cost?
Who owns the query or dashboard?
Was the optimization measured after the fix?
If you can answer these questions, you are no longer just monitoring Snowflake spend. You are governing the workload behavior that creates the spend.
Conclusion
Full table scans are one of the most common reasons Snowflake workloads consume more credits than expected. They happen when queries read far more data than necessary, often because of missing filters, broad dashboard queries, poor pruning, or misaligned table organization.
The solution is not always “use a smaller warehouse” or “turn on another alert.” The solution is to understand the workload.
Find the queries scanning too much data. Check whether they are recurring. Identify the owner. Apply better filters, reduce selected columns, improve pruning, and consider clustering only when the benefit justifies the cost.
Snowflake cost governance works best when teams manage not just infrastructure, but the workload patterns running on top of it.
Anavsan helps Snowflake teams move from cost visibility to workload accountability by detecting expensive query patterns, assigning ownership, and tracking optimization impact across queries, warehouses, storage, and AI services. Sign up here.
See how Anavsan governs your Snowflake costs
APEX detects cost anomalies, assigns them to the owning engineer, and documents savings with proof — automatically.
Frequently Asked Questions
SELECT * in repeated workloads, write pruning-friendly predicates, review high-scan dashboards, and consider clustering for very large tables when the performance benefit outweighs the maintenance cost.