Learn why BI dashboard refresh storms increase Snowflake credits, how concurrent dashboard queries affect warehouse runtime, and how data teams can control BI-driven cost spikes.
Introduction
BI dashboards are supposed to make data easier to consume. They give business users fast access to metrics, trends, and operational performance.
But behind every dashboard is a set of queries.
A single dashboard may generate 5, 10, 20, or even more SQL queries. Each tile, chart, filter, table, and KPI can send work to Snowflake. That may be fine when one user opens one dashboard. The problem starts when many dashboards refresh at the same time.
This is called a BI dashboard refresh storm.
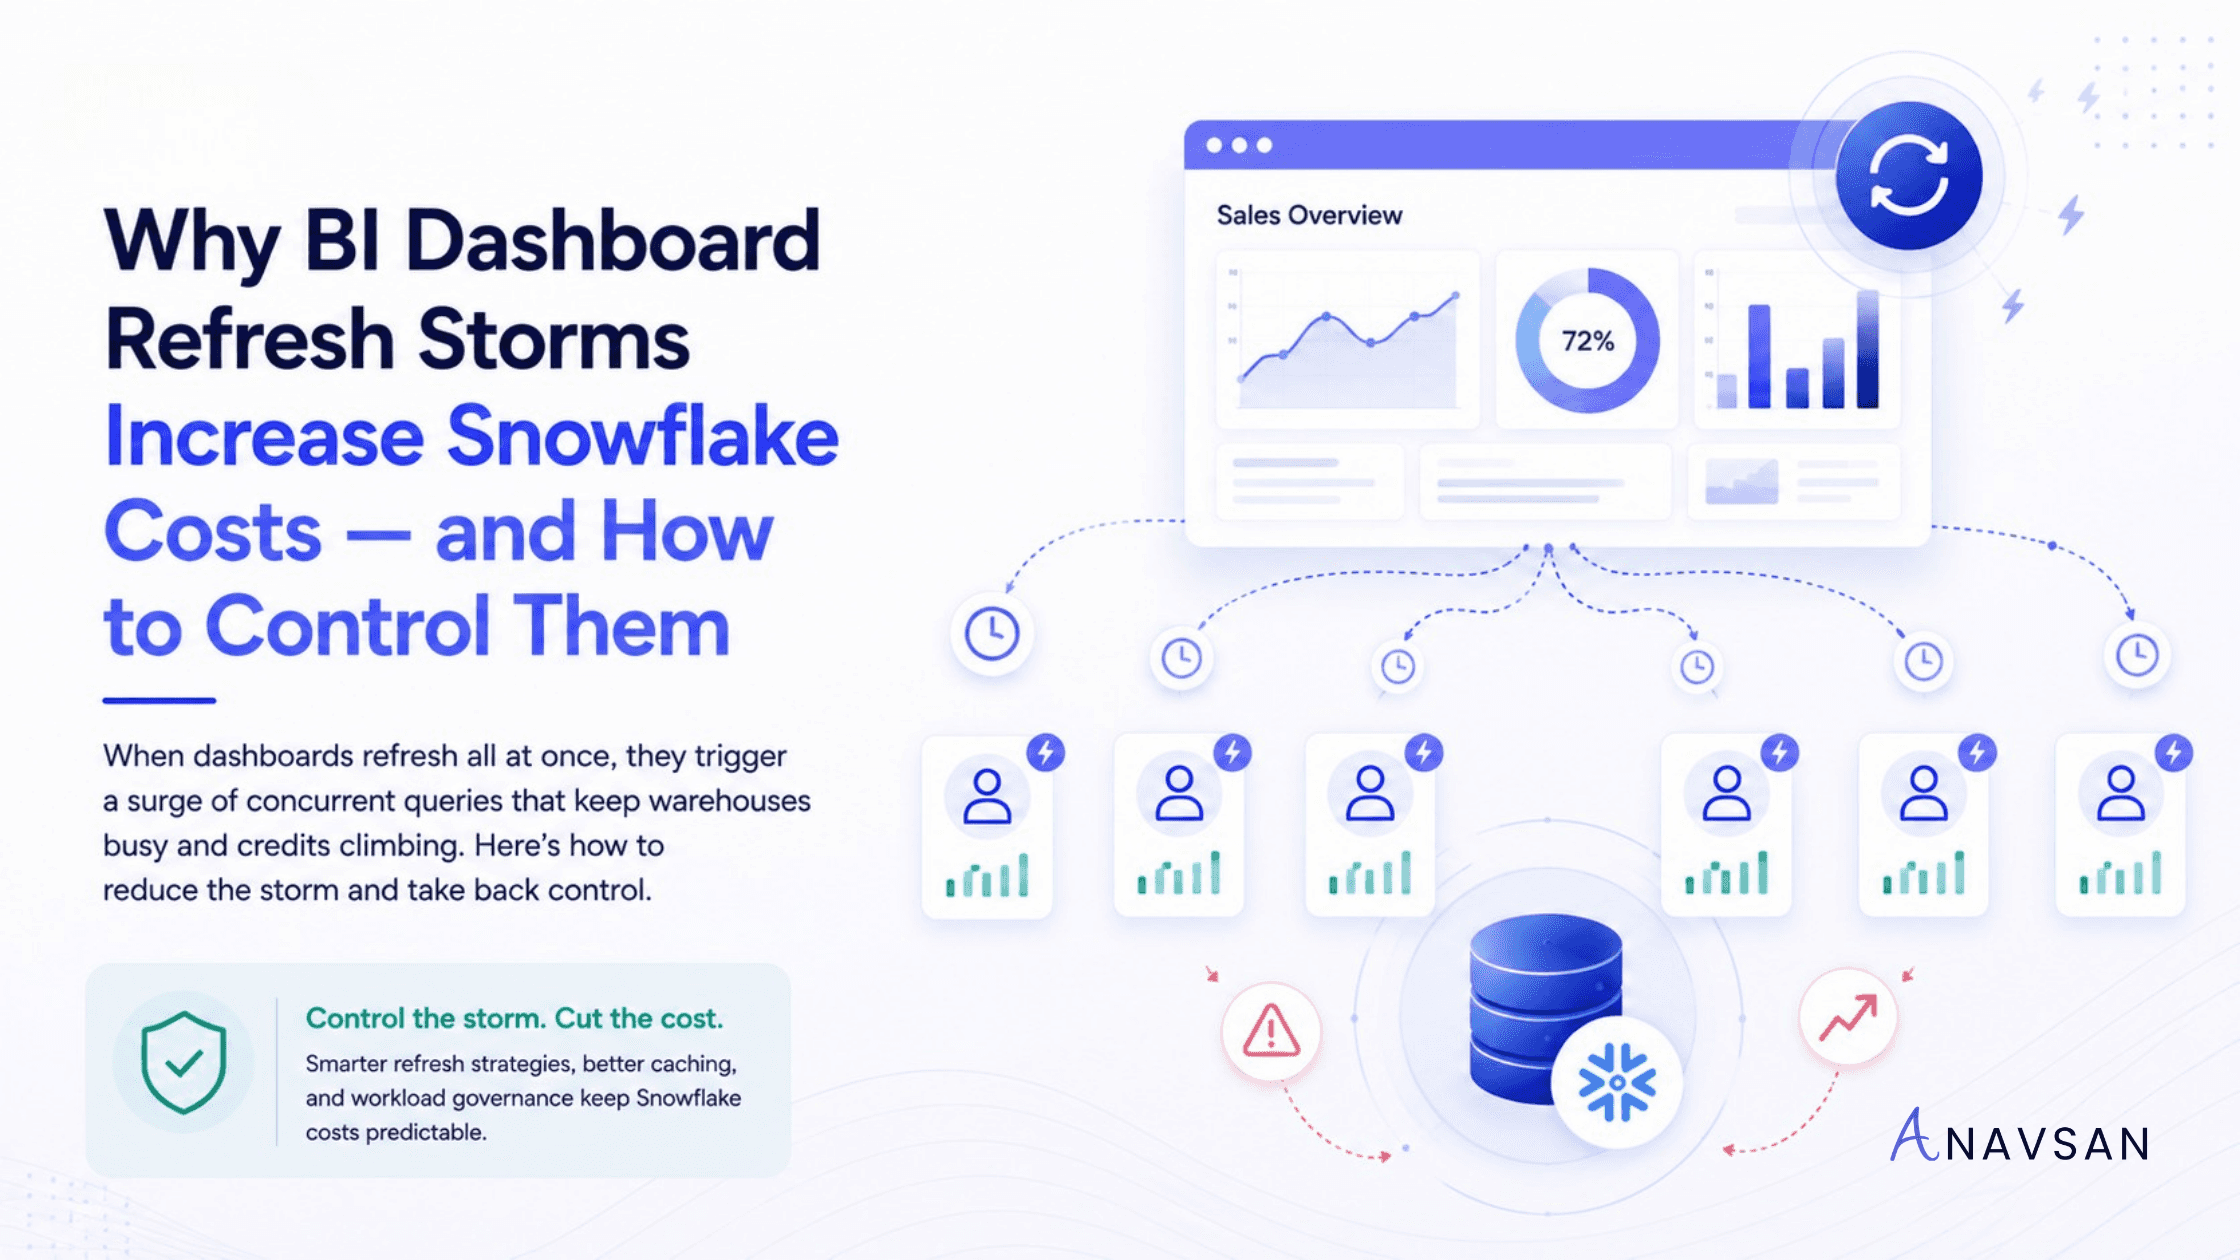
A refresh storm happens when a wave of dashboard queries hits Snowflake within a short period of time. It may happen at 9 AM when users start work. It may happen every hour because scheduled refreshes are aligned. It may happen after a data pipeline completes and dashboards automatically reload. It may also happen when a popular executive dashboard is opened by many users at once.
The result is simple:
Many dashboard refreshes → many concurrent queries → longer warehouse activity → higher Snowflake credits. This is why BI dashboard refresh storms are not just a reporting issue. They are a Snowflake workload governance issue.
What is a BI dashboard refresh storm?
A BI dashboard refresh storm is a burst of simultaneous or near-simultaneous dashboard queries that place sudden pressure on a Snowflake warehouse.
This usually comes from one of four patterns:
Many users open the same dashboard around the same time.
Multiple dashboards are scheduled to refresh at the same interval.
A BI tool refreshes many tiles or extracts in parallel.
Dashboards use broad filters that scan large tables repeatedly.
The important point is that dashboards do not consume Snowflake credits directly. The queries behind them do. When dashboard refresh behavior creates unnecessary or poorly timed query activity, the warehouse absorbs the cost.
Why dashboard refresh storms increase Snowflake costs
Snowflake warehouse credits are driven by warehouse size, number of clusters, and runtime. If a dashboard refresh storm causes warehouses to run longer, scale out, or process more queries than necessary, credits can increase.
The cost pattern usually looks like this:
Dashboard refresh → multiple queries → concurrency spike → warehouse stays active or scales → more credits consumed. This can happen in several ways.
1. More concurrent queries
Dashboard tools often run multiple queries at once. If many users refresh dashboards simultaneously, the same warehouse may receive a large number of concurrent queries.
If the warehouse does not have enough resources to process all of them immediately, queries may queue. If the warehouse is configured for multi-cluster scaling, Snowflake may start additional clusters to manage the concurrency. That can improve user experience, but it can also increase credits while additional clusters are running.
2. Longer warehouse runtime
Even when queries do not scale to extra clusters, they can keep a warehouse running longer. If dashboard refreshes continue throughout the day, the BI warehouse may rarely get a chance to auto-suspend.
This matters because a warehouse that stays active because of constant dashboard refreshes keeps consuming credits.
3. Poor cache reuse
Snowflake can reuse persisted query results when the same query is repeated and the required conditions are met. But dashboard-generated SQL often changes because of filters, timestamps, user-specific parameters, aliases, or tool-generated query variations.
When cache reuse fails, Snowflake recomputes the result. That means the same business metric may be calculated again and again.
4. Repeated broad scans
Some dashboards default to broad date ranges, “all regions,” “all customers,” or “all products.” This can make every refresh scan far more data than needed.
A dashboard that refreshes every hour and scans a large fact table each time can become a recurring cost leak.
5. Metadata polling
Some BI tools frequently query metadata to understand schemas, columns, tables, permissions, or available objects. These metadata operations may seem small, but frequent polling can add overhead, especially across many users and workspaces.
Common causes of BI refresh storms
Refresh storms are rarely caused by one bad query. They are usually caused by design and scheduling patterns.
Dashboards refresh too frequently
Many dashboards refresh more often than the business actually needs. A sales dashboard may refresh every 5 minutes even though the underlying pipeline updates once per hour. A finance dashboard may refresh hourly even though decisions are made daily.
When refresh frequency is higher than data freshness, teams pay for recomputation without getting better business value.
Refresh schedules are aligned
A common mistake is scheduling every dashboard to refresh on the hour.
At 9:00, 10:00, 11:00, and every hour after that, multiple dashboards hit the warehouse at the same time. This creates avoidable concurrency spikes.
A better approach is to stagger refresh schedules across time windows.
Every dashboard tile runs its own query
Some dashboards are built with many independent tiles, each running its own query. This can be useful for flexibility, but it can also create query explosions.
If 20 tiles refresh together and 100 users open the dashboard, the query volume can rise quickly.
Filters are too broad
Dashboard filters are often designed for convenience rather than cost. Defaulting to “last 12 months” or “all customers” may be useful for exploration, but it can be expensive for repeated dashboard views.
Better defaults can reduce unnecessary scanning.
Dashboards are duplicated
Teams often copy dashboards for departments, regions, or teams. Over time, many dashboards may contain similar queries with slight variations. This creates repeated computation across duplicated assets.
The business may think there are 20 dashboards. Snowflake sees hundreds of recurring queries.
Extract refreshes are not governed
Some BI tools use extracts or cached datasets. These can reduce live query pressure, but they can also become expensive if extract refreshes are too frequent, too broad, or scheduled at the same time.
Extract refresh governance matters as much as live dashboard governance.
Why this is a workload governance problem
Many teams try to manage Snowflake BI costs by looking at the warehouse bill. They identify the BI warehouse, see that it consumed credits, and then debate whether to resize it.
That is incomplete.
The real question is not only:
Which warehouse consumed credits?
The better question is:
Which dashboard behavior caused the warehouse to consume those credits?
A BI warehouse may be expensive because:
Too many dashboards refresh on the hour.
One executive dashboard runs 30 heavy queries per load.
Dashboard filters default to too much historical data.
Cache reuse is broken by dynamic SQL.
Extract refreshes run more often than the data changes.
Multiple teams duplicated the same dashboard logic.
No one owns old dashboards that still refresh.
These are not warehouse configuration problems. They are workload governance problems.
How to detect dashboard refresh storms
To identify refresh storms, review query history and warehouse activity together.
Look for these signals:
Query spikes at predictable times, such as every hour or every morning
Many similar queries from the same BI tool
High concurrency on BI warehouses
Queued queries during dashboard refresh windows
Repeated queries with low cache reuse
Dashboards with many tiles or long load times
High bytes scanned from dashboard queries
Warehouses that rarely auto-suspend during business hours
Extract refreshes that overlap with live dashboard usage
It is also useful to map queries back to dashboard names, BI users, teams, and refresh schedules. Without ownership, refresh storms become hard to fix.
How to control BI dashboard refresh storms
1. Stagger refresh schedules
Do not schedule every dashboard to refresh at the same time. Spread refreshes across the hour based on priority. For example, instead of refreshing 30 dashboards at 9:00 AM, schedule groups at 9:00, 9:10, 9:20, 9:30, and 9:40. This reduces concurrency pressure without removing access to data.
2. Match refresh frequency to data freshness
If the underlying data updates every hour, refreshing the dashboard every 5 minutes does not add value. If leadership reviews a dashboard once per day, it may not need hourly refreshes.
Align dashboard refresh frequency with the actual business decision cycle.
3. Reduce dashboard tile count
Every tile can generate a query. Review dashboards with too many visuals and remove low-value tiles. A smaller, focused dashboard is usually faster, cheaper, and easier to use.
4. Improve filter defaults
Use cost-conscious defaults. Instead of loading “all time” data by default, start with a recent time window. Instead of showing all customers or all products, encourage users to filter by segment, region, or business unit.
The goal is not to limit analysis. The goal is to avoid unnecessary scans on every refresh.
5. Improve cache reuse
Standardize dashboard queries where possible. Avoid unnecessary dynamic SQL, constantly changing timestamps, and user-specific query variations that prevent result reuse.
If many users need the same metric, make it easier for Snowflake to reuse the result.
6. Use aggregate tables or curated semantic layers
If dashboards repeatedly calculate the same metrics from large raw tables, consider creating curated summary tables, aggregate models, or semantic-layer definitions.
This reduces repeated computation and helps BI tools query smaller, more stable datasets.
7. Separate BI workloads
Do not mix all BI, ad-hoc exploration, and batch workloads on the same warehouse. BI workloads have unique concurrency and latency patterns.
A dedicated BI warehouse can make dashboard behavior easier to monitor, tune, and govern.
8. Review multi-cluster settings carefully
Multi-cluster warehouses can help with concurrency, but they can also increase credit usage when additional clusters start. Use them intentionally.
Track whether extra clusters are solving real user experience issues or simply absorbing poor refresh scheduling.
9. Assign dashboard ownership
Every high-cost dashboard should have an owner. The owner should understand how often it refreshes, who uses it, which Snowflake warehouse it hits, and what cost impact it creates.
Dashboard ownership turns BI cost optimization from a complaint into a workflow.
10. Retire unused dashboards
Old dashboards often keep refreshing even when no one uses them. Review dashboard usage and remove or disable scheduled refreshes for assets that no longer serve a business purpose.
This is one of the easiest cost wins.
Practical checklist for data teams
Use this checklist when reviewing BI-driven Snowflake spend:
Which dashboards trigger the most queries?
Which dashboards refresh most frequently?
Are multiple dashboards scheduled at the same time?
Do dashboard queries scan large tables?
Are dashboard filters too broad by default?
Are queries being reused from cache?
Are extract refreshes aligned with data freshness?
Are queries queuing during refresh windows?
Is multi-cluster scaling triggered by BI concurrency?
Which dashboards are unused but still refreshing?
Who owns each high-cost dashboard?
Did changes reduce runtime, queues, and credits?
This checklist helps move BI cost governance from warehouse-level reporting to dashboard-level accountability.
Conclusion
BI dashboard refresh storms are a common reason Snowflake costs rise unexpectedly. The issue is not that dashboards exist. Dashboards are essential. The issue is unmanaged refresh behavior.
When many dashboards refresh at once, Snowflake can see a surge of concurrent queries. Those queries may queue, trigger additional clusters, miss cache reuse, scan too much data, and keep warehouses running longer than necessary.
The fix is not simply to resize the warehouse. The fix is to govern the workload.
Stagger refresh schedules. Match refresh frequency to data freshness. Reduce unnecessary dashboard tiles. Improve filter defaults. Increase cache reuse. Assign dashboard ownership. Retire unused dashboards.
Good Snowflake cost governance does not stop at “which warehouse spent credits?” It asks “which dashboard behavior caused the spend, who owns it, and what changed after we fixed it?”
Anavsan helps Snowflake teams move from cost visibility to workload accountability by detecting cost-heavy dashboard patterns, assigning ownership, and tracking optimization impact across queries, warehouses, storage, and AI services. Signup here.
See how Anavsan governs your Snowflake costs
APEX detects cost anomalies, assigns them to the owning engineer, and documents savings with proof — automatically.